New Studies

A. Statistic

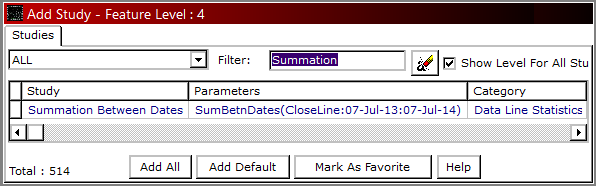
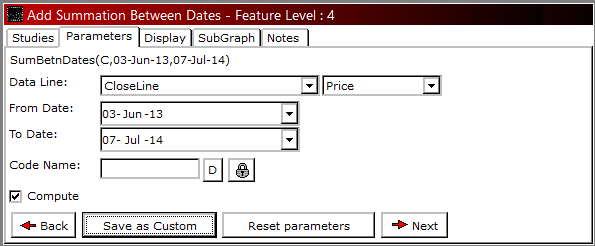
Summation Between Dates - It will sum up all successive DataLine Inputs for all trading days falling between the dates ranges specified by the user.

Value Between Start & End Time - It can be used on intraday charts to plot DataLine Input's value specified by the user. Start Time will pick up the candle and DataLine Input of that time and plot that value till the market end time if considered end time is checked, else will carry till the next day till the same time is encountered. Further user can write the condition on it to say if the price breaks that value anytime during the day, he can go long or short. The same can be back tested using a strategy across intraday data.

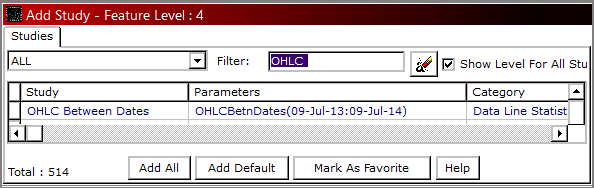
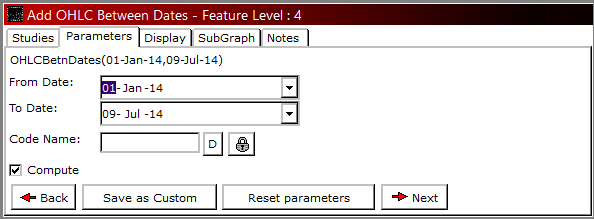
OHLC Between Dates - As we plot OHLC value of a daily candle, this study plots the OHLC value for Date Range Specified. For. E.g. Specifying from Date as 1st Jan 2014 and To Date as 31st May 2014 in this indicator will Plot Open of 1st Jan 2014, High as Highest High between dates range specified, Low as Lowest Low between date range specified and Close of 31st May 2014 till the last bar. It is carried till the last bar to detect breakout of High or Low for that date range.

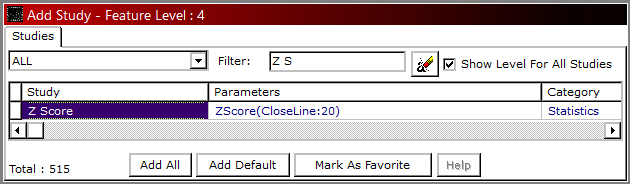
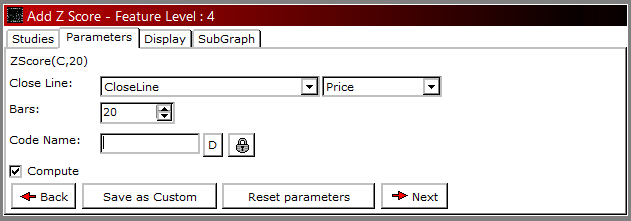
Z Score - This indicator plots a range starting from -2 level to +2 Level. It defines by how much factor the price has deviated from its specified average (Bars Input). Indicator's reading above 2 means prices has deviated 2 times more than the average on the upper side, and the same falling below +2 gives an opportunity to sell. Similarly its reading below -2 means price has deviated 2 times less than the average on the lower side and the same rising above -2 gives a buying opportunity.

B. Data Line Operations

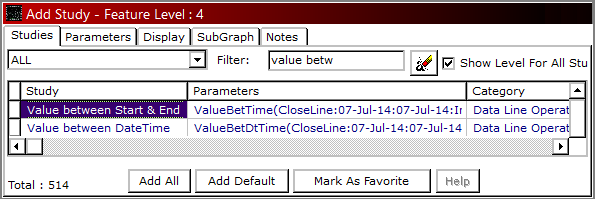
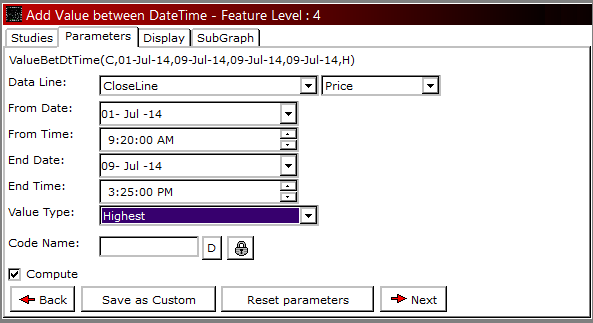
Value Between DateTime - This study returns Highest / Lowest value, Highest / Lowest Trigger Date and number of days (Calendar Days) passed from Highest / Lowest Trigger date of the DataLine Input specified by the user. It is a single study which can be used to get all 3 outputs in 1 step instead using 3 other indicators (High Low Value Between DateTime, High Low Days Between DateTime, High Low Date Between DateTime) for the same output.

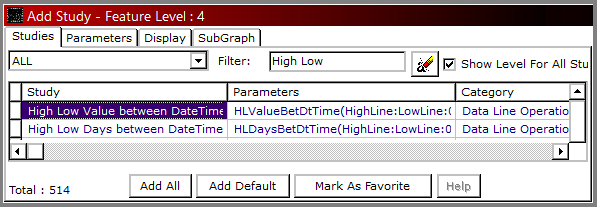
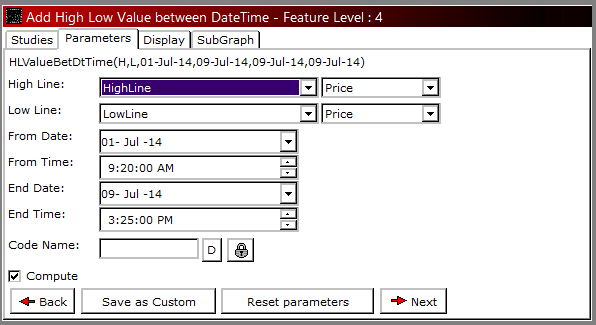
High Low Value Between DateTime - This study returns the Highest High and Lowest Low value triggered between the DateTime defined. This study is normally used in reporting system. When a user wants to know the highest high and lowest low value between two dates, he can use this study.

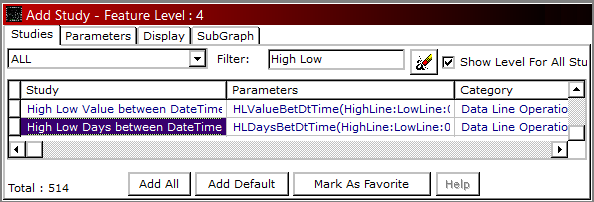
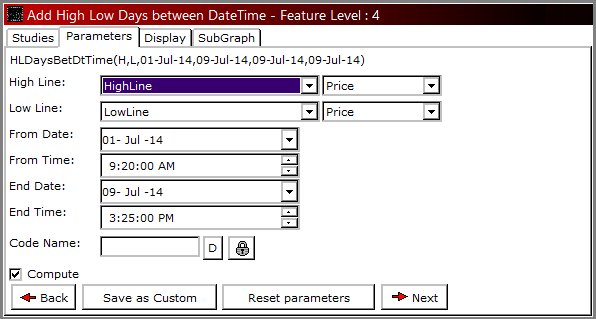
High Low Days Between DateTime - This study returns the number of days (Calendar Days) passed from the Highest High day and Lowest Low day. This study is used in reporting system.

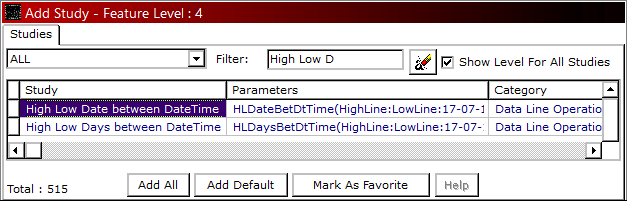
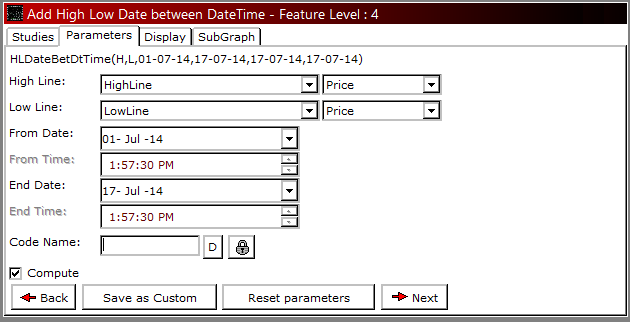
High Low Date Between DateTime - This study returns the date of Highest High Day and Lowest Low Day. This study is used in reporting system

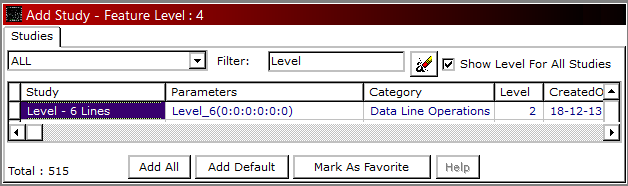
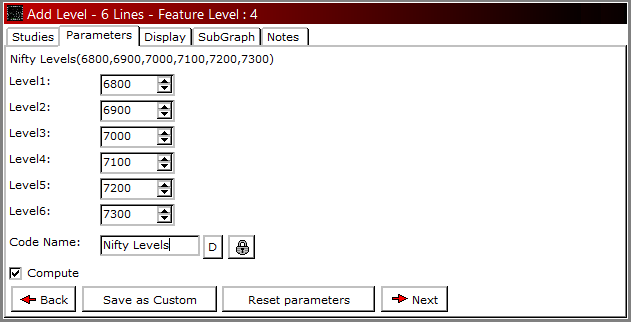
Level - 6 Lines - Plots 6 user defined levels on Price Chart. It functions the same way as Level - 2 Lines or Level - 1 Line does. Here in 1 step, user can plot 6 levels or less on chart. Further, it can be used to write condition or plot signals on a specific / multiple level breakouts showing buying or selling opportunities.

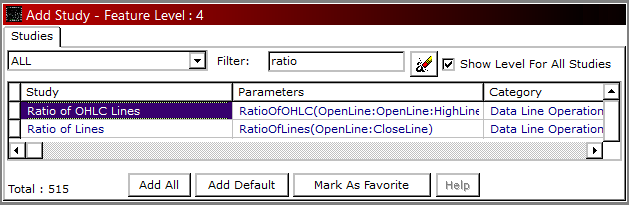
Ratio Of OHLC Lines - Spread traders uses this study. Study named Ratio Of Lines enables user to find out the Spread ratio between 2 contracts by plotting Another Scrip Close on the existing chart and using their prices as input in the study. This upgraded study can help these users to plot not only close price difference but OHLC price difference too. The same can be plotted in Candlestick form, where further averages and other indicators can be plotted over.

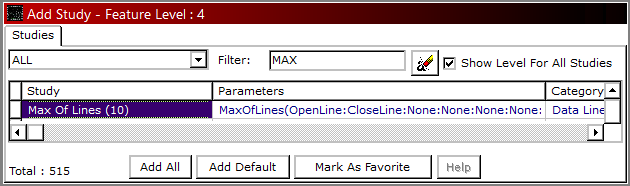
Max Of Lines (10) - Plots or return a Highest value among 10 or less input values specified by the user. Let say there are 4 to 5 moving averages or Price based indicators on the chart and the user wants to know the highest value of all so that he can place that as a stop loss for a Buy Trade.

Min Of Lines (10) - Plots or return a Lowest value among 10 or lesser input values specified by the user. Let say there are 4 to 5 moving averages or Price based indicators on the chart and the user wants to know the lowest value of all so that he can place that as a stop loss for a Sell Trade. This is when he can use this study.

Line Addition - This study in the new version has been renamed to Add To Line.

Line Subtraction - This study in the new version has been renamed to Subtract From Line.

C. Volume

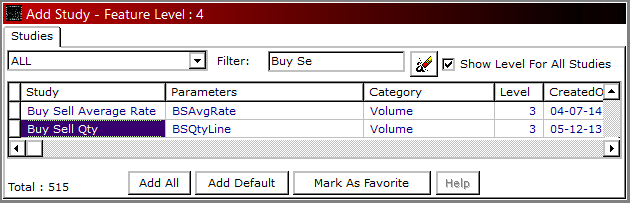
Buy Sell Qty - It can be plotted on Intraday Charts. This plots two lines on a sub-graph, 1 line gives value of the sum of all buy ticks, and the other line gives the value of sum of all sell ticks on each bar. 1st Line (BuyQty) higher than 2nd Line (SellQty) would mean Buyers are taking control and vice versa.

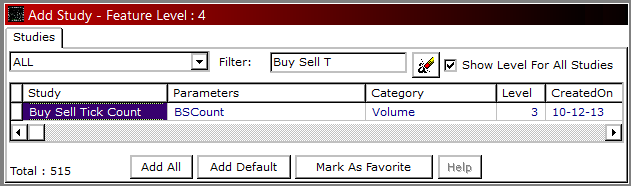
Buy Sell Tick Count - This study gives count of all buy and sell trades on each bar. BuyTickCount higher than SellTickCount would mean that Buyers are taking control and vice versa.

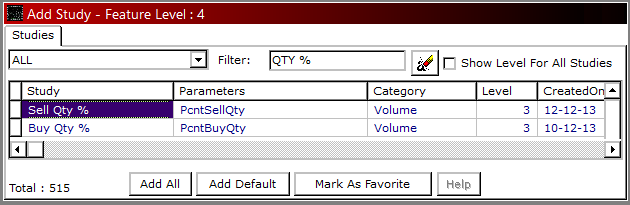
Buy Qty % / Sell Qty % - It’s a percentage distribution between Buy and Sell ticks on each bar. BuyQty % gives percentage of BuyTrades, similarly SellQty % gives percentage of SellTrades. BuyQty% higher than SellQty% would mean that Buyers are in control and vice versa.

Buy Sell Value - This study plots 2 lines. 1st line gives output of Buy Value (BuyQty*ClosePrice) calculated on each tick. Similarly, 2nd line gives output of Sell Value (SellQty*ClosePrice) calculated on each tick. It is interpreted as when BuyValue line is above SellValue line it is trending upward and vice-versa.

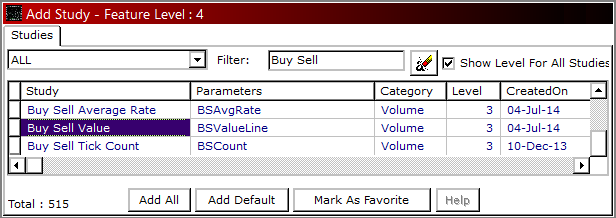
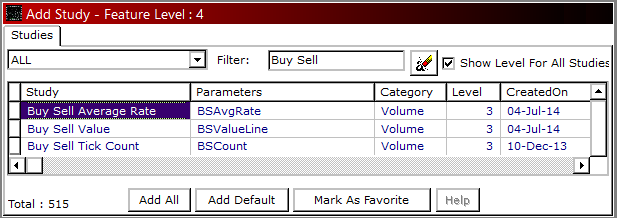
Buy Sell Average Rate - This study plots 2 lines. 1st line gives output of Buy Average Rate (BuyValue / BuyQty) calculated on each tick. Similarly, 2nd line gives output of Sell Value (SellValue / SellQty) calculated on each tick. It is interpreted as when BuyAvgRate line is above SellAvgRate line it is trending upward and vice-versa.

D. Price

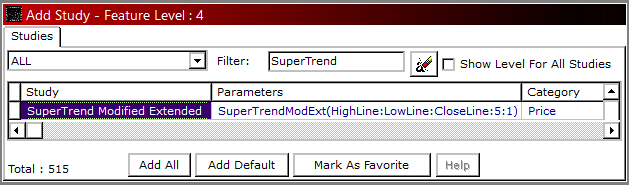
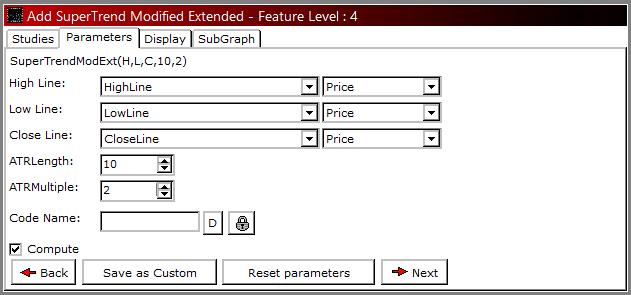
SuperTrend Modified Extended - In old study Super Trend Modified, user could only change the input parameters of ATR Length and ATR Multiple factors, based on which Super Trend Modified use to plot it considering by default High, Low and Close prices. Now with this study in place, use can change the price inputs of High, Low and Close too. If Prices are above Super Trend Value, it is said to be in Buy zone with Stop Loss of Super Trend Value and vice versa.

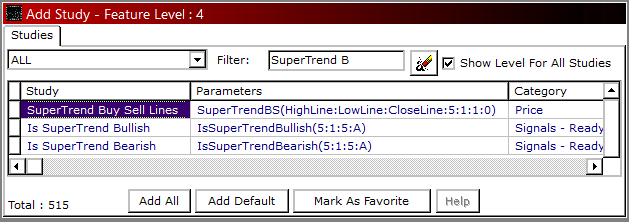
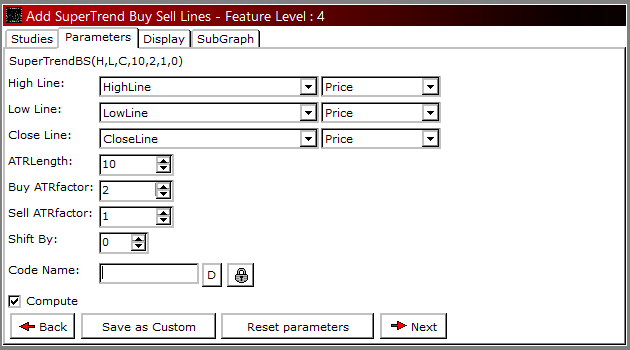
SuperTrend Buy Sell - This study is similar to SuperTrend Modified except it plots Buy SuperTrend and Sell SuperTrend Lines differently if Buy Factor and Sell Factor are not same. To plot Buy SuperTrend line, it takes ATR Length and Buy ATRFactor inputs and for Sell SuperTrend Line; it takes same ATR Length and Sell ATRFactor inputs.

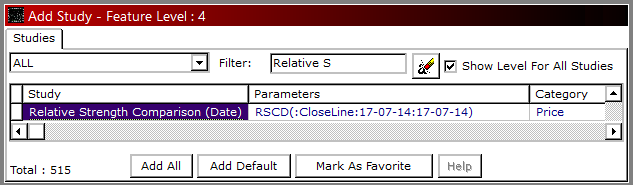
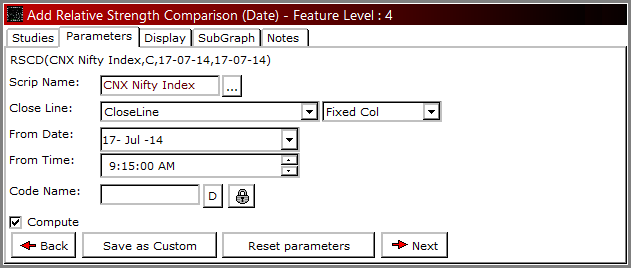
Relative Strength Comparison (Date) - This study compares two securities to analyze their performances. It finds the percentage ratio of input price line (OHLC) for two different securities from a specific date. When the value returned by this indicator moves up, the security is out-performing the input security, similarly when it is moving down, it is said to be underperforming than the input security.

Volume Weighted Average Price - is a new name given to Up To Tick Avg.

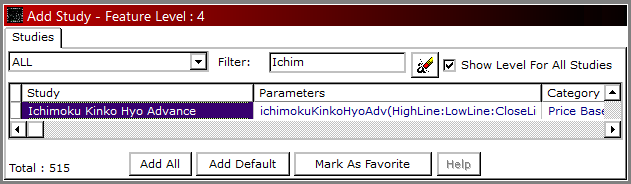
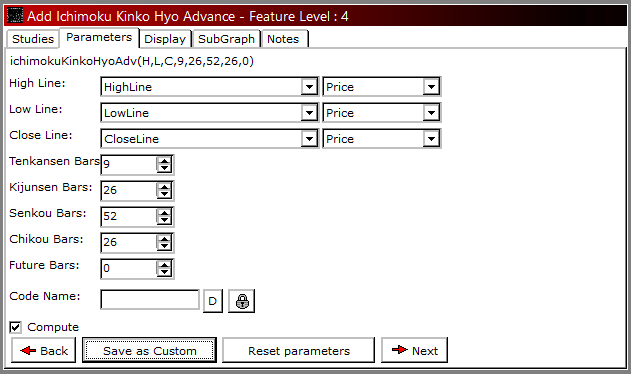
Ichimoku Kinko Hyo Advance - Advance name in this indicator is because here user can opt to have future bars display of this indicator's value or not. If future bars is specified as 0, this indicator will not extend, else it will extend for a number of bars ahead as specified.

E. Options

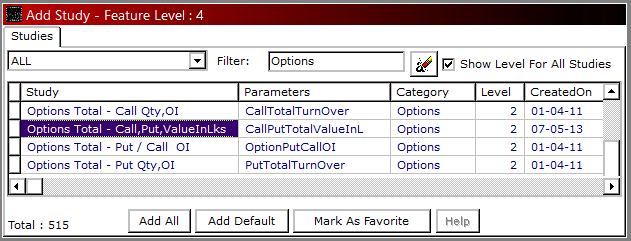
Options Total - Call, Put, ValueInLakhs - This indicator plots 2 lines on sub-graph. One gives Call Total Turnover and the other gives Put Total Turnover in Lakhs for the corresponding contract.

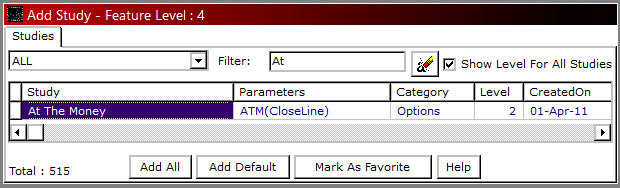
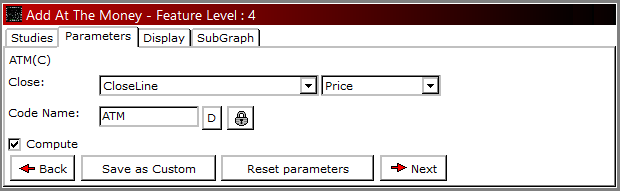
At the Money - This indicator plots At the Money Option’s Strike Price on the chart

F. Momentum

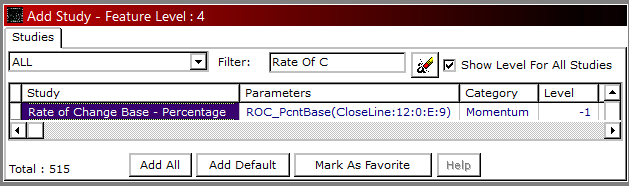
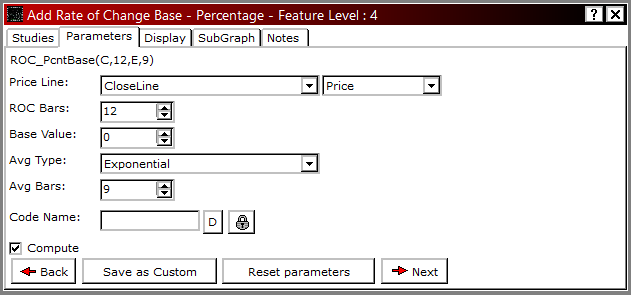
Rate Of Change Base - Percentage - It measures the percentage change in price with price n periods (ROC Bars) ago, however with a base value specified. The other indicator named Rate Of Change has a default base value of 100. It behaves the same way as ROC except the reading of normal ROC gets added to 100 value if base is 0. Similarly, if base value is 10, ROC value gets added to 90 on each bar and likewise. Along with ROC Line, A signal line which is a moving average of ROC Line by 9 bars is plotted. If ROC is above level (100-BaseValue), it is said to be trading in Positive territory and vice versa.

G. Overbought / Oversold

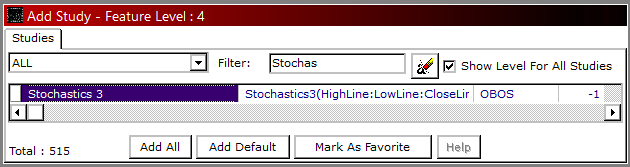
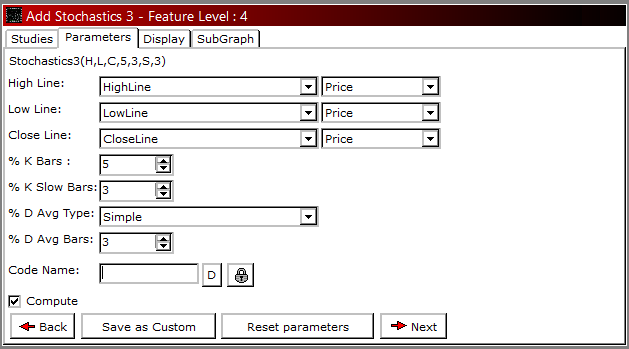
Stochastics3 - It is a momentum indicator that shows the location of the current close relative to High-Low Range over last N-time periods. This calculation gives stochastic %K value. Further to smoothen this, moving average of %K is calculated to give stochastic %K Slow value. To further smooth it out, moving average of %K Slow is calculated to give stochastic %D value which has 3 outputs. Readings over 70 indicate overbought zone and reading below 30 indicate oversold zone in a sideways market.

Strategy – Advance Ultimate

Add Study --> Strategy – Advance Ultimate
With the introduction of Strategy - Advance Ultimate, user can now execute their long and short trades with different Priceline entry and exit point respectively while testing strategies. This study is available to pro users.

For Advisors

  • Signal Manager

Signal Manager can be accessed from Trading Menu in F7 versions. This window acts as an interface between Signal sending Source (Chart / Scan) and Signal receiving Tracker (Signal Tracker), which can be further pushed to an auto trading platform. Currently, it supports Trade genie (An Auto Trading Platform). User can test their strategies in simulated mode live during the market. Suppose user has following 12 charts, it can be less or more. All have strategies plotted on it. If he wants to capture their Long / Short and Exit signals, he will have to run all chart strategies in Simulated mode. How can he do that?

Go to Trading --> Signal Manager --> Strategy Tab.

Click on Strategy Refresh --> Resume All --> Apply Pause / Resume.

These settings in place will make sure that it starts pushing Long / Short and Exit signals for the stocks put in Simulated Mode on a real time basis in Signal Tracker.

Options may not come in Signal Tracker if Long Signals? / Short Signals? / Long Exit Signals? / Short Exit Signals? in Signal Manager --> Settings tab are not checked. It may also not come if signals come before / after time depending on the option that is checked.

If you are following a positional call on any contract, you may want it to show you as Open Positions. You can see them all in Signal Tracker. All you need to do is, check the option that reads “Load Previous Days Open Positions (For Next Session) in Signal Manager --> Settings Tab and Click on Publish all Previous Open Positions for signals lying open in Summary Tab. Look in Signal’s Performance, how Open Positions appear in Signal Tracker.

Note :- User can Close an open position by highlighting the record and click on Close Button, In order to close all open orders, he can click on Close All.

Signal Manager comes with more refined features in Settings Tab as shown below:-

Consider Exit irrespective Of Open Positions.

It will allow user to send Exit signals even if the position in a security is not open through a strategy.

Send Exit Signals on Opposite Signals

If a strategy triggers a fresh position (long / short) with an exit to the previous open position on the same bar, it will first send exit signal of the previous position and then a fresh signal for the position to open.

Resume Strategies on Reconnect

Due to internet fluctuation or data being stopped for any reason, the charts from simulated exchange mode goes in Paused mode. In paused mode, the signals are not sent. If it happens, application automatically tries to reconnect the server to resume strategies in simulated mode so that signal sending on real time does not stop.

  • Publish Signals

A special feature introduced to a broker or individuals who want to send their Signals to list of people who follows their signals. It is available in all F7 applications on a certificate named F7.Analyst. These users can Publish Signals, Publish Snapshots and even send a custom message to their clients. Publish Signals? Will publish all signals coming in Signal Tracker to a specific Template Name. Whoever gets access to this Template Name will be able to receive the published signals. Publish Snapshots? Will publish the chart snapshot taken at the time of signals generated. Message? Analyst can send message across a template name to their clients in case of any specifics to be communicated.

  • SMS Signals for All Signals

Analyst can even send SMS to their clients on their cell phone as Signal triggers in Falcon7 with a custom defined message. This feature is available on certificated named SMS.Signals. URL in case of Default contains our URL through which SMS are sent and it allows 20 SMS in a day.

If Analyst has their own custom link (URL) for SMS sending, the Number of SMS he can sent will be as per the limit set in his URL. Custom link can be activated on Clicking Custom Option. He can add up to 250 mobile numbers, who can receive SMS of Signals in Signal Tracker.

  • Measure Signal’s Performance (Signal Tracker)

Signals triggered from Charts / Scan come automatically in Signal Tracker from Signal Manager with bundle of useful information to make the decision even stronger. It gives potential profit (Peak Profit %), where one can know the Max profit gained from the system during the trade. It shows live Profit % gained / lost while the position is being held. It gives that Stock’s specific sector performance along with % Of Stocks in Advances and Declines. If Value2 is more than 50%, it means more than 50% of the stocks in that sector have risen or declined in turn helping to decide to ride the trade in the direction of the Trend.

More information on the sector can be fetched by double clicking on ADS value in Info2 column. The screen below is presented, which shows the power of bullishness and bearishness among scrips in the sector that confirms the trade in favor of direction 1 step ahead.

Signal Tracker has lots of other flexibilities too.

  • It has 'M' button which Hides / Unhides the Message Section.
  • Button 'E' to Hide / Unhide Exit Signals Section.
  • Settings tab has 'From Start' checkbox, this option when checked user will receive published signals from Reliable or Any Analyst (On Subscription).
  • Analyst can export the signals data in excel from Signal Tracker.
  • Option added to select either Long Beep or Short Beep, which will set the beep sound whenever a new signal comes either in long beep or short beep.
  • By default only ' Summary Signals ' Section will be visible.

  • Rule-Based Ready Trading System

Welcome to Rule Based Trading Systems. In order to be successful, it is important to follow a system with Discipline throughout. One also needs to know his Risk profile so that accordingly money is deployed in the system.

Reliable has launched Positional trading system that is back tested over 3 years of intraday data. We tested it on different intraday time frames and finally we concluded that 15 min time frame is better to do intraday trades. Hence our system is made on 15 min time frame. 12 future contracts that we have selected are highly liquid across segments. It is a Trending system, where we profit from runaway trades and get out of the trades which are not in favor soon. Hence we don’t have any stop loss levels; however it will certainly give an exit signal as soon as the Trend reverses. One has to follow it minimum on 4 / 6 / 8 Charts by picking their own stocks to trade out of these 12 stocks that we suggest.

The image above is the visual of Positional Trading System developed by our Research Experts on 12 liquid future stocks. Access to the above layout is already given to all F7 users. You can go to Desktop --> Load Desktop and double click on “DCSion Pos 2 F” to open the above Trading Layout for yourself. Opened layout will have 12 charts, all colored with 3 types of Bars.

Green Bars signifies Bullishness, Red Bars signifies Bearishness and White Bars signifies Sideways.

Positional Buy, Sell and Exit Rules are as follows.

Buy - 1st Green Bar confirmed at the opening of the 2nd Bar.

Buy exit - 1st White Bar after consecutive Green Bars.

Sell - 1st Red Bar confirmed at the opening of the 2nd Bar.

Sell exit - 1st White Bar after consecutive Red Bars.

Above Signals that triggers from Chart will automatically popup in Signal Tracker with bundle of useful information to make the decision stronger. It gives potential profit (Peak Profit %), where one can know the Max profit gained from the system during the trade. It shows live Profit % gained / lost while the position is held. It gives that Stock’s specific sector performance along with % Of Stocks in Advances and Declines. If Value2 is more than 50%, it means more than 50% of the stocks in that sector have risen or declined in turn helping to decide to ride the trade in the direction of the Trend.

More information on the sector can be fetched by double clicking on ADS value in Info2 column. The screen below is presented, which shows the power of bullishness and bearishness among scrips in that sector which confirms the trade in favor of direction 1 step ahead.

Note :-

1) 5 or more days of past Intraday data needed.

2) Access to studies of level 2 (F7Net, F7Adv and above) and above will be required.

Key to Success

  • Trade with equal value in each scrip.
  • Take each trade generated from the system.
  • Buy / Sell / Exit as per the system.
  • Follow it minimum on 4 charts or more.
  • Evaluate the Strategy Performance Monthly.

Disclaimer:-Trading in stocks or derivatives is subject to market risks and may result in monetary or any other kind of loss. Please consider carefully whether such trading is suitable for you. Keep in view your financial condition and ability to bear financial risks. Reliable Software System Pvt. Ltd has an experienced team to develop Trading Systems that recommends Stock selection, Buy, Sell and Exit Signals in liquid counters. These signals have to be considered as suggestions only. Reliable Software Systems Pvt. Ltd or any of it associates shall not be held liable for any loss or gain incurred using any Trading Signals. Reliable Software Pvt. Ltd takes best efforts but does not guarantee the accuracy or timeliness or completeness of all information and is not responsible for any omissions or delays.

  • Floating Login

Here is a feature that was awaited for a long time. Clients who want to use Falcon7 at 2 different places being able to login one at a time can now avail the benefit of this feature.

In this feature there will be 2 machines where Falcon7 is installed. One will be the Main Machine, and the other can be called Sub-Ordinate machine. It is exclusively available to F7Net Clients.

Here the main machine will allow Floating Login to the second machine.

To enable this feature, main machine should be assigned with certificate named ‘F7Net.Floating’. Then user can navigate across Menu Bar and Click Personal --> My Details --> Click on Enable Floating Login.

It will present a numeric Node ID, which can be used in another machine to be able to go online to get live data while Main machine is not connected or if it’s connected it will get disconnected.. The main machine will restart after message is displayed to restore the floating login feature.

To start another machine on Floating Login, user can navigate across Menu Bar, Click onPersonal --> My Details --> Select ‘Floating’ --> Put Node ID in ‘Master Node ID’ presented by main machine --> Click on ‘Send Details’. It will bring main machine’s validation on to this machine and user will start getting live data on this whereas the main machine will get disconnected if it is connected with the message below. The next time user restarts this machine; it will automatically go on to connecting without repeating the same steps as above. One more advantage of using this feature is both machines can be connected together in the offline state, It’s only when Live data is needed, user can have on either of the machine.

  • Watches

Event Tracker

Event Tracker now comes with Extra Column “TOVerLk”. It will display Turnover value in Lakhs. By Default Always Sort On Time Option will be checked in Event Tracker, so that all events come in sequential order.

Tick Watch

Tick watch is also enhanced with additional features, They are as under :-

  • The expression can be represented a tick watch results category in Money / Number format.
  • Money - Displays the numerals in decimals
  • Number - Displays the numerals without decimals (Round Figure)
  • Extra Column “TOVerLk” is added. It will display Turnover value in Lakhs.
  • ‘Spread’ - This new series will filter the 'Spread' group for the applied conditions
  • Added Always sort on time, if this setting is selected ticks will come 1 over the other on the top in sequential order.


New Variables

  • SMA5 - Stores the value of Simple Moving Average for 5 days
  • SMA10 - Stores the value of Simple Moving Average for 10 days
  • SMA20 - Stores the value of Simple Moving Average for 20 days
  • SMA30 - Stores the value of Simple Moving Average for 30 days
  • High5 - Stores the value of Highest high for 5 days
  • Low5 - Stores the value of Lowest low for 5 days
  • High10 - Stores the value of Highest high for 10 days
  • Low10 - Stores the value of Lowest low for 10 days
  • High20 - Stores the value of highest high for 20 days
  • Low20 - Stores the value of lowest low for 20 days
  • High30 - Stores the value of highest high for 30 days
  • Low30 - Stores the value of lowest low for 30 days
  • Scan

Signal Scan

This settings in Signal Scan will perform the calculation of Indicators / Signals / Strategies used within for only loaded no. of Intraday data here. As a result this will save on the time scan takes to scan a query and will improve the performance. User have to make sure that he loads sufficient number of Intraday data here for scan depending on the number of bars considered in his indicator / Signals / Strategies….

In Results Tab, We have ‘Number of digits after decimal’ added, which displays the number of decimals after a value.

  • Chart Properties and Customization

Tile Chart Alphabetically

If more than one charts are opened on the screen, user can now Tile them Alphabetically as below…

- Chart Settings

- Display Bar Settings

Chart Settings --> Display 1 Tab

Bars have 4 options now.

  • Minimum Bars
  • Display Bars
  • Future Bars
  • Load Bars

Minimum bars will allow user to scroll the chart minimum up to 2 bars.

Display bars will always open the chart with a number of bars specified.

Future Bars will leave that many numbers of bar ahead of the chart for price projections, retracements, etc.

Load Bars will load only that many numbers of bars on all charts. It is helpful when user wants to look and do analysis on only 200 or custom bars.

- Candle Border

Chart --> Chart Settings --> Display2 --> Show Candle Border Color (Present at the bottom)

This feature colors the candle border to a color that users choose to be from Chart Settings --> Color Tab. By default on a black background it colors White and on a white background chart it colors in Black.

- IntraPeriod-wise Tools

- Show Daily Tools in Higher Period

Chart --> Chart Settings --> Display2

IntraPeriod-Wise Tools, when checked it will show the tools drawn only on specific intraday time frame on which it is drawn. It will not show on other Intraday Period time frames.

Show Daily Tools in Higher Period, when checked will show the tools drawn on Daily Time frame on higher periods i.e. on Weekly, Monthly, Quarterly and Yearly Charts.

- Show Tools

By default, this setting is true (selected), if Show Tools is made False (unchecked) then tools related options will be disabled, and all the tools will hide from the chart. If it is checked, all tools will come back and become visible.

- LTP Level On Intraday Chart

Chart --> Chart Settings --> Levels On Intra

Added LTP in Levels on Intra Tab. LTP (Last Traded Price) line will be shown on full intraday history. Also the labels for different levels that come on an intraday chart can be aligned Left or Right so that it should not overlap the other labels.

Other Chart Properties

- Bracket Report

Bracket Report - Will display bracket report for a chart on which it is activated.

+ Gap --> If Todays open > Previous Day’s High

- Gap --> If Todays open < Previous Day’s High

High (Value) Bracket --> (Today’s Low > Tomm Low) and (Today’s High > Tomm High)

Low (Value) Bracket --> (Today’s Low < Tomm Low) and (Today’s High < Tomm High)


- EOD Data Entry

EOD Data Entry - Allow users to add / delete / modify prices on the EOD data of a scrip.

- Log Scale

  • Log Scale converts the chart in Logarithmic scale.

- Show Toolbar

  • Will Show Toolbar on the chart at the bottom giving you access to various shortcuts

- Show Horizontal Grid

  • Will draw horizontal grids based on the price scale on the chart.

- Show Vertical Grid

  • Will draw vertical grids based on the time scale on the chart.

- Hide User Text

  • Will hide all user texts if any on the chart.

  • Alerts

Default Settings

Alerts have been modified to improve user experiences.

There are changes in the Default settings:-

  • While adding new alerts for a scrip, the period will be Daily.
  • CloseLine will be the default field which can trigger an event on real time.
  • Comparison operator will be >=
  • Current Rate (LTP) will pop up by default for that scrip.

Added Mark All / UnMark All button to make easier for the user to Activate and Deactivate all Alerts.

Remove All Triggered

Remove All Triggered button will remove all triggered alerts, so that user’s Alert Box is not populated with the ones that are not required. Alert Pop-up Position is set to bottom right hand side corner of the screen

  • Redefining Ways in Strategy Back testing

Breakeven Settings (In Multiple Of Entry Stop) – For Pro Users

Breakeven Trigger - ___

Breakeven Stop - ___

Start Stop Trailing after Breakeven Triggers – For Pro Users

Above settings in place under Stops Menu of Strategy Settings will find the difference between defined stop loss and Entry Price. This difference is the favorable move that your strategy should attain to trail your stop to breakeven.

For. E.g. User has made a strategy using Strategy Pro, which has Long signal as Moving Average Crossover (E10, E50), E50 (Medium Moving Average) in Long Stop, Entry Stop as 10 % and Trail trigger & stop at 8 % each. If long entry is taken at 500 Rs. The10 % stop loss will come to 450 Rs. Moving Average value on that candle is 460. Here the Stop Loss will be the Highest of Moving Average and Entry Stop i.e. 460 Rs. Hence the difference between Entry Rate and Stop Loss comes out to be 40 Rs.

Now, If Breakeven Trigger and Stop both are set to 1 with Start Stop Trailing after Breakeven Triggers settings ‘On,' the stop loss will remain constant at 460 Rs., till the security moves above 540 Rs. (Maintaining 1:1 ratio). After 540 Rs. on every potential move, the stop loss will trail considering the highest high of Moving Average and Trailed stops. If Start Stop Trailing after Breakeven triggers is unchecked, it will simply consider the highest high of Moving Average and Stop loss to trail on every successive bar.

Note: - (Similarly, user can use any multiple here depending on his strategy preferences. It can be even 1:1.10, so that Entry stop trails above Breakeven point by 0.1 %).

Ignore Indicator Stops Before Breakeven Triggers – For Pro Users

In the example above, the stop loss considered in the beginning was the highest high of Moving Average and Stop Loss, which was 460 Rs. (Value of Moving Average). There can be a situation where user wants only Entry Stop to be considered for Breakeven Trigger and after that the highest high of indicator and stop loss value. During such scenarios user can check this option. This setting will work along with other two settings being checked.

Till Stop / Target is Hit Ignore Opposite Signals

Any Strategy Testing that has Entry Stop, Trail Trigger, Trail Stop, Stop Increment or Target in place with required stop type selection, the above settings when checked will not square off the trade until the stop / target is hit. It helps to avoid whipsaw while the trade is continuation in either upward or downward direction. Please refer to the following screenshot where a long trade is continued with lots of false short trades in between which is ignored due to this setting.

Remember and Apply Opposite Signal (If Any), After Stop / Target is Hit – For Pro Users

This setting would immediately take the reverse trade of the previous trade if there was an opposite signal just before the previous trade was squared off. There is a possibility of missing a rally in the reverse direction if this remains unchecked. For E.g. Stop loss of a long trade got hit and before that there was a sell signal, which converted into a downtrend rally. If this setting would not be checked, it will ignore the same trade and if it would have been checked it would take the sell trade and continue the sell trade across the rally. This Selection is available for Pro users. Please look at the below screenshot.

Conservative Trailing

Assume user has Stops (Entry Stop, Target, Trail Trigger and Trail Stop) set in strategies with Price High Line, Low Line as HighLine, LowLine in Strategy settings file. He can opt to trail his stops on Higher Lows being formed in case of Buy trade provided the difference between the Higher Low, and Entry Rate is more than Trail Trigger. Similarly, in case of a Sell trade, stops will be trailed on Lower High being formed provided the difference between the Lower High and Entry rate is more than the Trail Trigger.

Conservative Stop

Situation where Stop and Target both are getting hit on a single candle, this setting in place will square off the trade on Stop Loss to make sure that the profitability results are not misleading. The situation will not arise if the factor for Stop Loss and Target are increased or strategy is made on a lower time frame while back testing strategies.

Profitability Report

Maximum Drawdown (Rs.) – Measures the max drawdown incurred while working on a strategy. It is the maximum of the difference between Peak and trough at any given point of time.

Total TurnOver – Turnover of all the trades taken in a Strategy

MTM column is added in Profitability in Bar wise report.

  • Personal
  • Application Settings

Application Settings --> Intra Tab --> 'Ignore Data after exchange end time' will not add ticks on intra chart aftermarket end time for a particular exchange.

Application Settings --> Application Tab --> ’Zoom Chart on Single Monitor’. With this setting, while zooming a selected chart, it will zoom on a single monitor. Before, without this setting, it used to zoom on all monitors.

Application Settings --> EOD Tab --> ‘Adjust Dividend’ is for Cash and ‘Adjust Dividend for Derivatives’ for Futures contracts. This option will adjust dividend days as per the ratio factor. Adjust Dividend will not change the prior or current signals as all prior data will also get adjusted as per the ratio factor and accordingly even the indicator’s reading that is giving the signals will get adjusted.

  • Export Related Changes

Exports available to all clients are as follows:-

  • 100 Bars Data Export (OHLCV) from Data --> View Period-wise Data for any Scrip on Intra / Daily / Weekly / Monthly / Quarterly / Yearly period.
  • Market Watch Data can be exported after every 30 minutes from Right Click Market Watch --> Save As --> CSV (*.csv).
  • Scan --> Signal Scan --> Export Up to 300 Records on Daily / Weekly / Monthly / Quarterly / Yearly period.

Exports available at an additional cost are as follows:-

  • Last 50 days of Intraday Data Export (OHLCV) up to 5 Min or Higher Time Frame after-market hours while LIVEDATA is connected.
    Certificate required - .DataExport.4000.(Segment) (4000 Records only). Exporting is allowed from View Period-wise Data for any Scrip.
  • 5 Years of Daily Data (OHLCV) from View Period-wise Data for any Scrip on Daily / Weekly / Monthly / Quarterly / Yearly period.
    Certificate Required - .Data Export (1250 Records).
  • Export Daily Data with studies for all Scrips or a group from Signal Scan. Certificate Required - .DataExport.NSECash / .DataExport.BSECash / .......so on.
  • Exporting Tick by Tick data of Current Day from View Period-wise Data for any Scrip (For Scrip wise) - Any 1 scrip. Certificate Required - .DataExport.NIFTY.Intra.
  • DDE Excel Export - 1 instance (NSE Cash / F&O / BSE Cash / MCX) at any given point of time.
    Lease line - Certificate Required - F7.DDE. Export, to Excel from Market watch.
    Internet - Certificate Required - F7Net.DDE. Export, to Excel from Market watch. .
  • Export Market Watch data in Excel up to 300 Records without 30 minutes constraint.
    Certificate Required - F7.MarketWatch.Export / F7Net.MarketWatch.Export.

  • Most Advantageous Features

Chart --> Tool Settings --> Show Color

User can now color the tool just before finishing drawing any tool on chart. While drawing any tool, when user selects the last point, it will prompt to choose the color to be given to that tool.

New Shortcuts

Customize Hotkeys (Chart -> Customize Hotkeys / Ctrl + F2) is a window that lists all Shortcuts (Hotkeys) for different function to use on charts.

It allows user to use keyboard keys for short cuts as per his convenience instead of using the mouse for different options for that particular activity. User can also edit different keys for a different function.

Lot of new shortcuts has been added for user’s convenience, and they are as under….

Shortcuts Function added in Customize Hotkeys are as below :-

  • Move Mouse Right – Moves the mouse cursor on the right sidebar by bar provided there are less than 80 bars in view.
  • Move Mouse Left – Moves the mouse cursor on the left sidebar by bar provided there are less than 80 bars in view.
  • Show Toolbar – Shows Toolbar at the bottom of the chart below Time scale. It has other shortcuts that can be performed on the chart.
  • Show Horizontal Grid – Will draw horizontal grids based on the price scale on the chart.
  • Show Vertical Grid – Will draw vertical grids based on the time scale on the chart.
  • View User Text – Will show all hidden user text if any on the chart.
  • Hide User Text – Will hide all user texts if any on the chart.
  • Exact Dates – Exact Dates enable user to see the chart view only from till to selected dates.
  • Full Screen Mode – Full screen mode sets the Falcon screen to cover the whole monitor space.
  • Show Bracket Report - Will display bracket report for a chart on which it is activated.
  • EOD Data Entry - Allow users to add / delete / modify prices on the EOD data of a scrip.
  • Show Tools – Will Hide / unhide all tools drawn on the chart.
  • Adjust RBS – Will adjust / unadjust the Right / Bonus / Split date’s data on chart.
  • Profitability Report – Will open profitability summary view of the strategy plotted on the chart.
  • Today’s First Candle – Bring the first opening candle of the day in case of Intraday chart.
  • Up to Todays First Candle – This will work if we have Todays First Candle on Intraday Chart, Using this shortcut will show today’s Intraday history right from the first candle till last candle.
  • Tool -> Highest High – It catches highest high of all the candles on the chart.
  • Tool -> Lowest Low – It catches Lowest Low of all the candles on the chart.
  • Customize Hot Keys – Brings Customize Hot Keys window where we can learn different shortcuts or can modify the shortcuts as per our convenience.
  • Increase / Decrease Price Sub graph – It will expand and reduce the sub graph area on the chart.
  • Invert Price Scale – This shortcut helps in viewing the chart’s mirror image (Inverted image)

Group Summary --> No Buyer / No Seller Scrips

User can go to Scan --> Group Summary and select the desired group to get to this window. This window has options to see Top Gainers and Losers / Top Volume gainers / Top Momentum Gainers and Losers / Top OI Gainers and Losers and High Volume Circuit stocks in graphical format for the selected group. Only Buyer and Seller is the new filter added in this window. This will show Top Turnover Scrips with Upper Circuit on the left column and Top Turnover Scrips with Lower circuit on the right. Also this will automatically refresh on timer to show the Top always in the list.

More Number of Intraday data access

Pro Users:-

  • Access to 500 days of intraday data in Live Mode.
  • Access to 1000 days of intraday data in Replay Mode.
  • Maximum Ticks / Candle loading can now be increased from 2 Lakh to 4 Lakh in Replay Mode.
  • Range Bars Intraday data can now be loaded for 400 days.

All Other Users:-

  • Access to 250 days of intraday data in Replay Mode.
  • Maximum Ticks / Candle loading can now be increased from 30 thousand to 1 Lakh in Replay Mode. Range Bars Intraday data can now be loaded for 100 days in Live Mode and during Replay Mode for 250 days.
  • Users with .Intra300 / .Intra400 (Loading 300/400 days of Intraday data) can now load 1 Lakh Tick / Candle in Live Mode.

Higher Studies Loading Facility to Lite Users

F7NetLite Users can now load the studies / strategies that are made using higher level studies used in Basic / Pro versions of Falcon.

Useful Columns in Groups / Related Scrips & Scrip By Name window

Windows through which user open chart of different companies has been added with additional useful columns.

Scrip By Name – Shortcut C

Here the user types the name of the scrip / contract to open the chart. This window now comes with additional column of Turnover represented in crores.

Groups – Shortcut G

By pushing G on any chart user can bring Groups Window through which he can open any Scrip / Contract’s chart. This window has two additional columns as Turnover represented in crores and PcntChg with respect to previous days close.

Specific group selection done on any chart that is saved on a desktop will be retained next time if the same desktop is opened.

Related Scrips – Shortcut Ctrl+B

By pushing Ctrl+B on any chart user can bring Related Scrips window which contains the related scrips trading in other segments (Cash / Derivatives). Even this window has additional columns as Turnover represented in Crores.

Graph View

Graph View can access through right click on any numeric column which can perform mathematical operations. The window below is View Period data Window accessed through Data menu. This contains numerical columns as ClosePrice, Volume, DelQty, etc. for a contract. Here user can right click on any numeric column and click on Graph view to get graphical representation of that specific column.

SiteLock